
See how residents and staff use it.
Visitors, the reporting funnel, channels, app opens, active staff and the costs that drive them, with no cookies and no personal data.
What it does
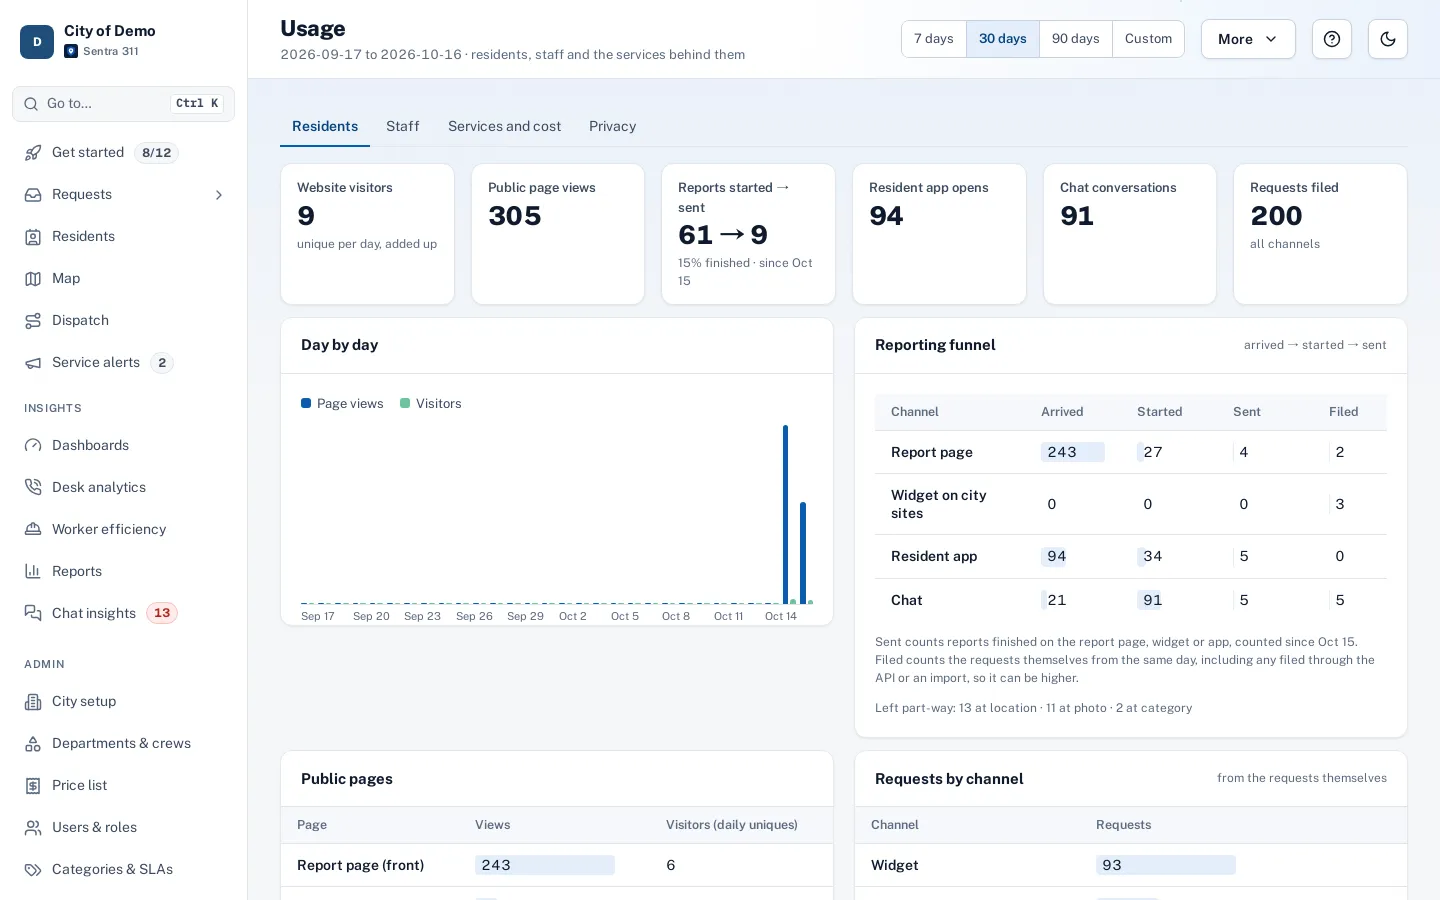
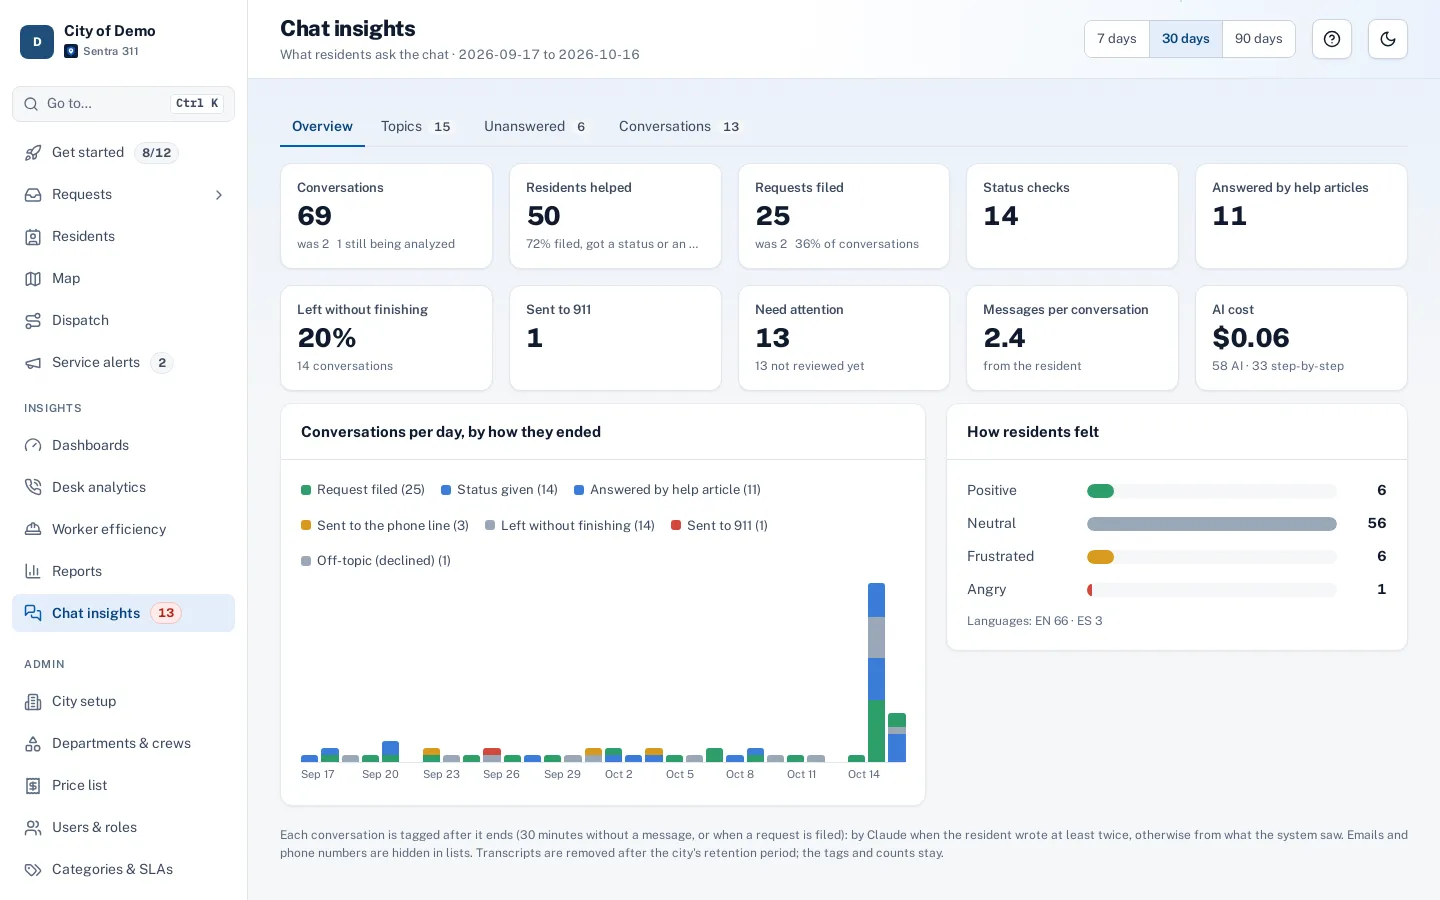
The usage page shows how residents and staff use Sentra 311: visitors to the report page, the reporting funnel (started, each step, sent, or where people left), where requests came from (web, app, widget, chat, phone), resident and worker app opens, active staff by role, chat use and knowledge base views.
It also estimates the costs that grow with use — map tiles, routing, AI tokens, emails and storage — so you know what drives them. All of it is cookie-free: no personal data is stored, and each city can turn analytics off.
You can’t improve adoption you can’t see.
How it works
Count, privately
No cookies, IPs or names stored; unique visitors via a daily-changing code.
Follow the funnel
Started, each step, sent, or where people left.
Watch the costs
Map loads, routing, AI and email.
Key features
Reporting funnel
From the first page view to a filed request.
App and staff adoption
App opens, active workers and active staff by role.
Cost drivers
Maps, routing, AI, email and storage.
Privacy first
Daily-changing anonymous counts; Do Not Track respected.
A day with it
Public web and widget: page views of the report front page, tracking and performance pages; the report funnel (started, each step, sent, or the step where people left); chat opens and messages; and which websites the widget loads on.
- Resident app: opens and the report funnel.
- Worker app: opens, active workers and jobs closed in the app.
- Staff portal: page views by section and active staff by role.
- Server-side: map loads, routing calls by provider, AI calls and tokens by feature, emails by kind and storage used.
- Requests by channel and chat conversations come straight from the database.
- Each number is shown for the period you choose, with a daily chart and a CSV download.
- A cost table estimates what map tiles, routing, AI and email would cost at list prices, so you can see what drives cost as adoption grows.
In practice
- After launch. Staff see how many residents start a report and where they stop.
- Channel mix. The numbers show most reports come from phones on the web, not the app.
- Cost drivers. The cost table shows maps and AI as the main usage costs.
Privacy approach
Usage analytics never sets cookies and never stores an IP address, browser string, email or staff ID. A unique visitor is counted with a one-way code built from the visitor’s network and browser plus a random value that changes every day, so the same person can’t be linked across days.
Using the numbers
Watch the report funnel after launch: if many residents start a report but leave at the location step, the report page’s map or address search may need attention in your area; if they leave at a type’s questions, the form may be too long. Compare channels to see whether residents prefer the website, the app or the chat, and promote accordingly.
Getting started
On by default and cookie-free; admins can switch it off in Admin › Usage.
Who uses it
City managers
Know whether the investment is being used.
IT staff
See cost drivers.
Questions cities ask
Do residents see a cookie banner?
No. There are no cookies to consent to.
Can CSP see our usage?
Platform administrators at CSP can see each city’s totals side by side to support customers and plan capacity.
Can we export the numbers?
Yes, as CSV for the chosen period.
Is usage data shared with anyone?
No. It stays in your city’s Sentra 311 account; CSP platform admins can see totals to provide support.