
How is each department doing?
Open now, filed and closed, median time to close, SLA met, reopen rate and the oldest open request, compared with the previous period.
What it does
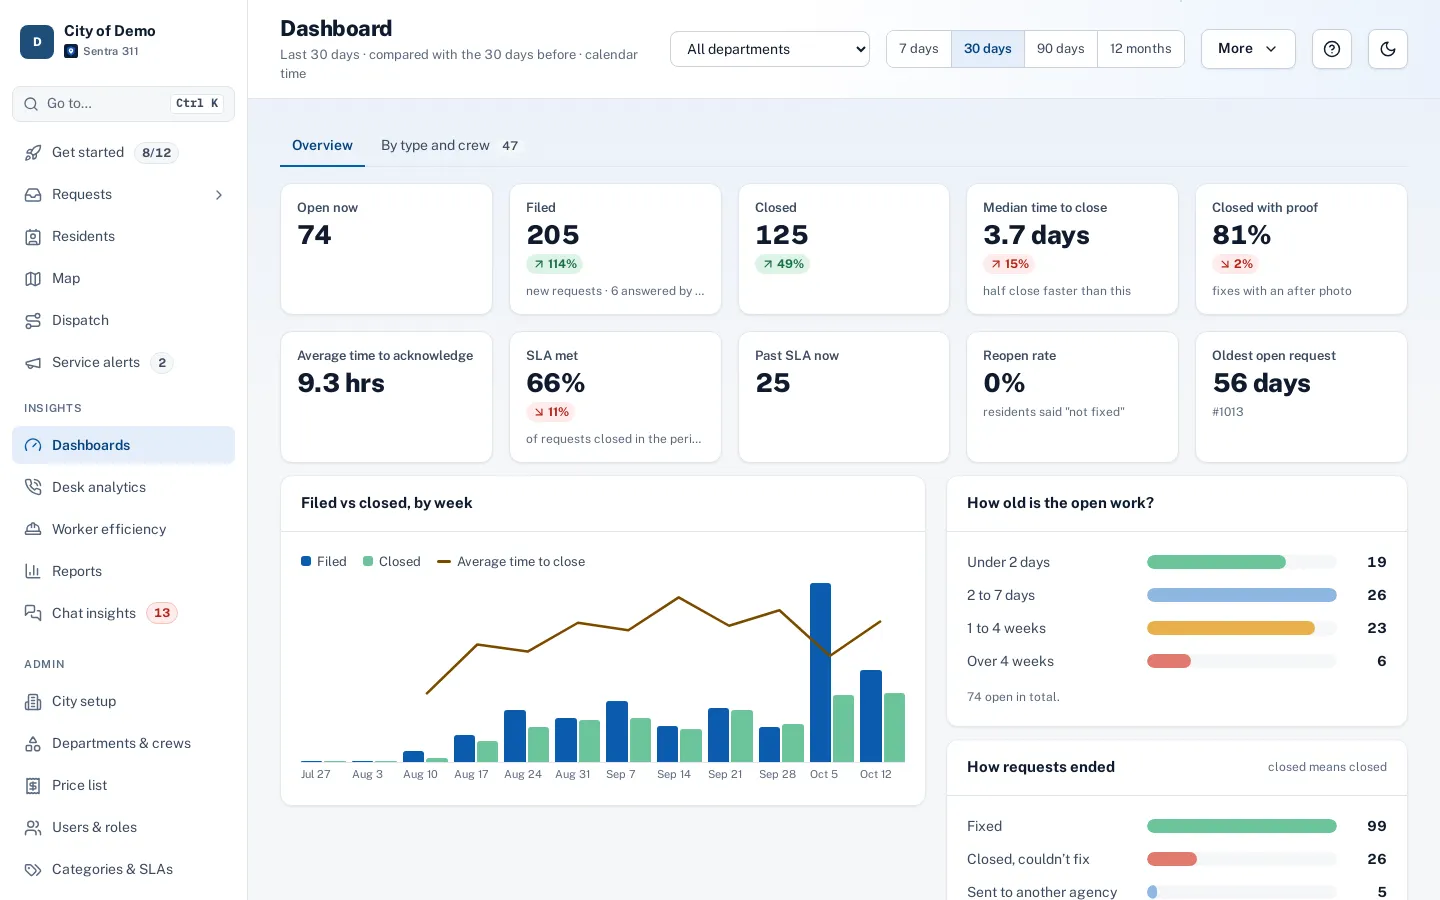
Sentra 311’s department dashboard shows the numbers a department head and a city manager ask about every week: requests open now, filed, closed, median time to close, average time to acknowledge, SLA met, requests past SLA now, reopen rate, the oldest open request and the share of fixes closed with proof — each compared with the previous period of the same length.
Below the numbers: a twelve-week trend of filed versus closed with average time to close, the age of open work, a breakdown by request type and by crew or worker, how requests ended, and the oldest open requests with links to each one.
Department heads find out they’re behind when a council member calls.
How it works
Pick a department and period
7, 30, 90 days or 12 months.
See the trend
Filed vs closed by week, and the age of open work.
Find the bottleneck
By request type and by crew, with the oldest requests listed.
Key features
Ten key numbers
With change versus the previous period, colored for better or worse.
Calendar or business time
Time to close measured either way; business time uses your hours and holidays.
By type and by crew
Where the time goes, with median time to close and SLA met per type.
Oldest open work
The longest-waiting requests, one click away.
Answered by the knowledge base
How many requests help articles headed off.
Department scoping
Department heads see their own departments; admins see every department.
A day with it
Open now; filed in the period (with how many requests help articles answered); closed; median time to close; average time to acknowledge; SLA met (for requests closed in the period); past SLA now; reopen rate (requests residents said weren’t fixed); oldest open request; and closed with proof.
- Each number shows its change from the previous period of the same length — up or down, colored by whether that’s better or worse.
- Choose the period (7 days, 30 days, 90 days or 12 months), the department, and whether time is measured in calendar time or business time.
- Business time uses your business hours and holidays, so a request filed Friday evening isn’t counted as late on Monday morning.
In practice
- Weekly check-in. A public works director compares this month’s median time to close with last month’s.
- Aging work. The aging chart shows a growing pile of requests older than four weeks.
- Proof of work. “Closed with proof” shows how consistently crews attach after photos.
Charts and tables
A twelve-week chart compares requests filed and closed each week, with a line for average time to close. An aging chart shows how old the open work is (under 2 days, 2 to 7 days, 1 to 4 weeks, over 4 weeks).
Getting started
Dashboards work from day one; numbers become meaningful after a few weeks of requests, or immediately if you import your history with the importer.
Who uses it
Department heads
Weekly check-in on their department.
City managers
Compare departments and trends.
Council members
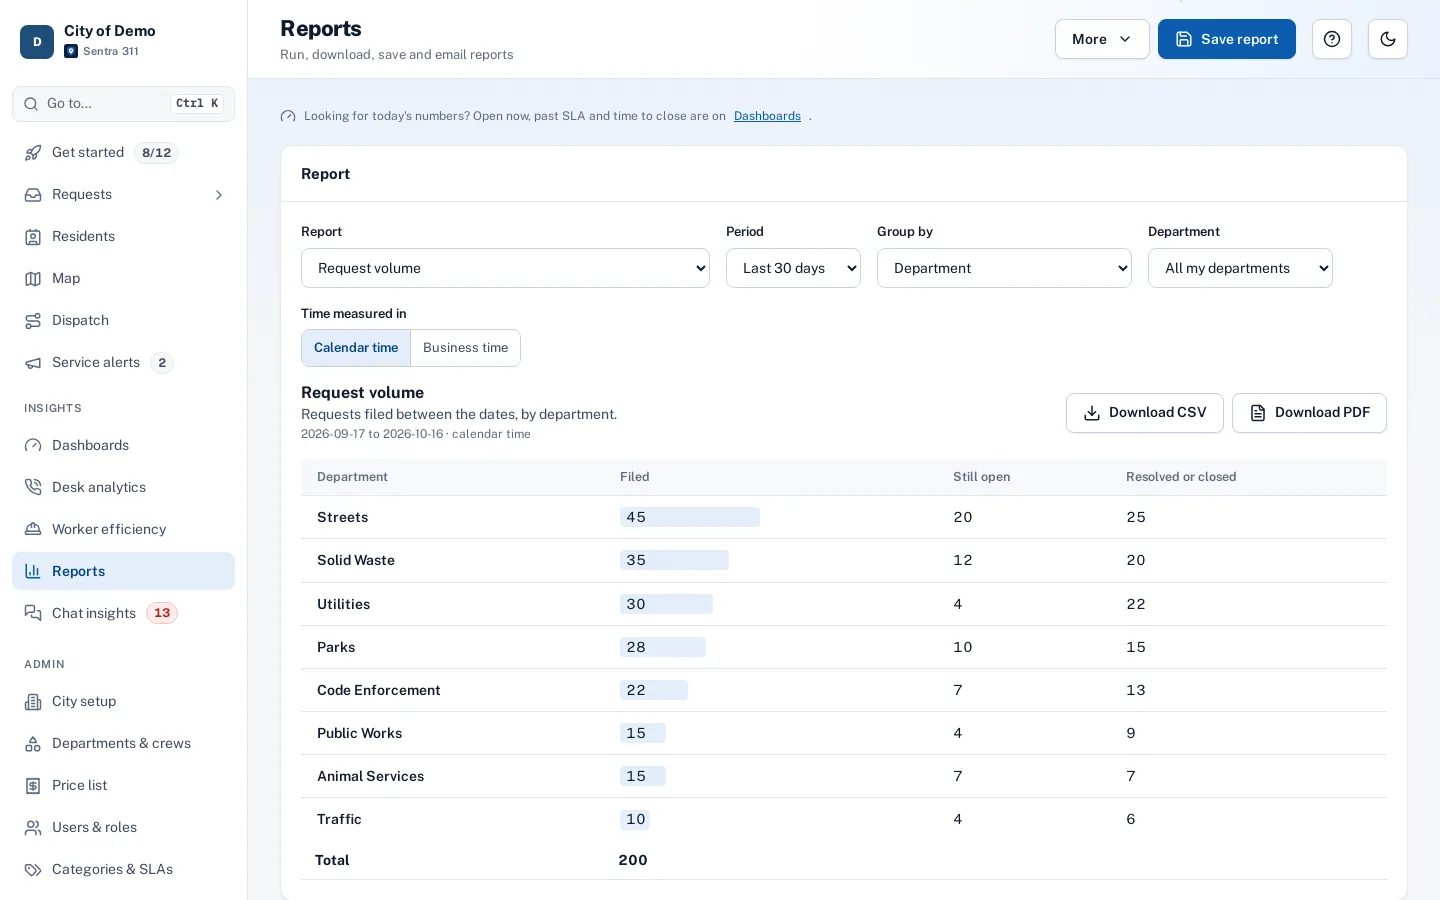
Ask for the same numbers through reports.
Questions cities ask
Are dashboards fast with years of data?
Yes. Numbers are calculated in the database and cached briefly; a city with 100,000 requests loads a 12-month dashboard in about two seconds.
Can department heads see other departments?
No; department heads see their own departments. City admins see all.
Can we print a dashboard?
Yes, from the browser; for regular delivery, use a scheduled report.
What does “closed with proof” mean?
The share of fixes closed with the proof the type requires, such as an after photo.