
Show residents the work you’ve done.
A public "Work we’ve done" page: requests fixed, typical time to fix, on-time percentage, a trend, before-and-after photos and a map. One switch to publish.
What it does
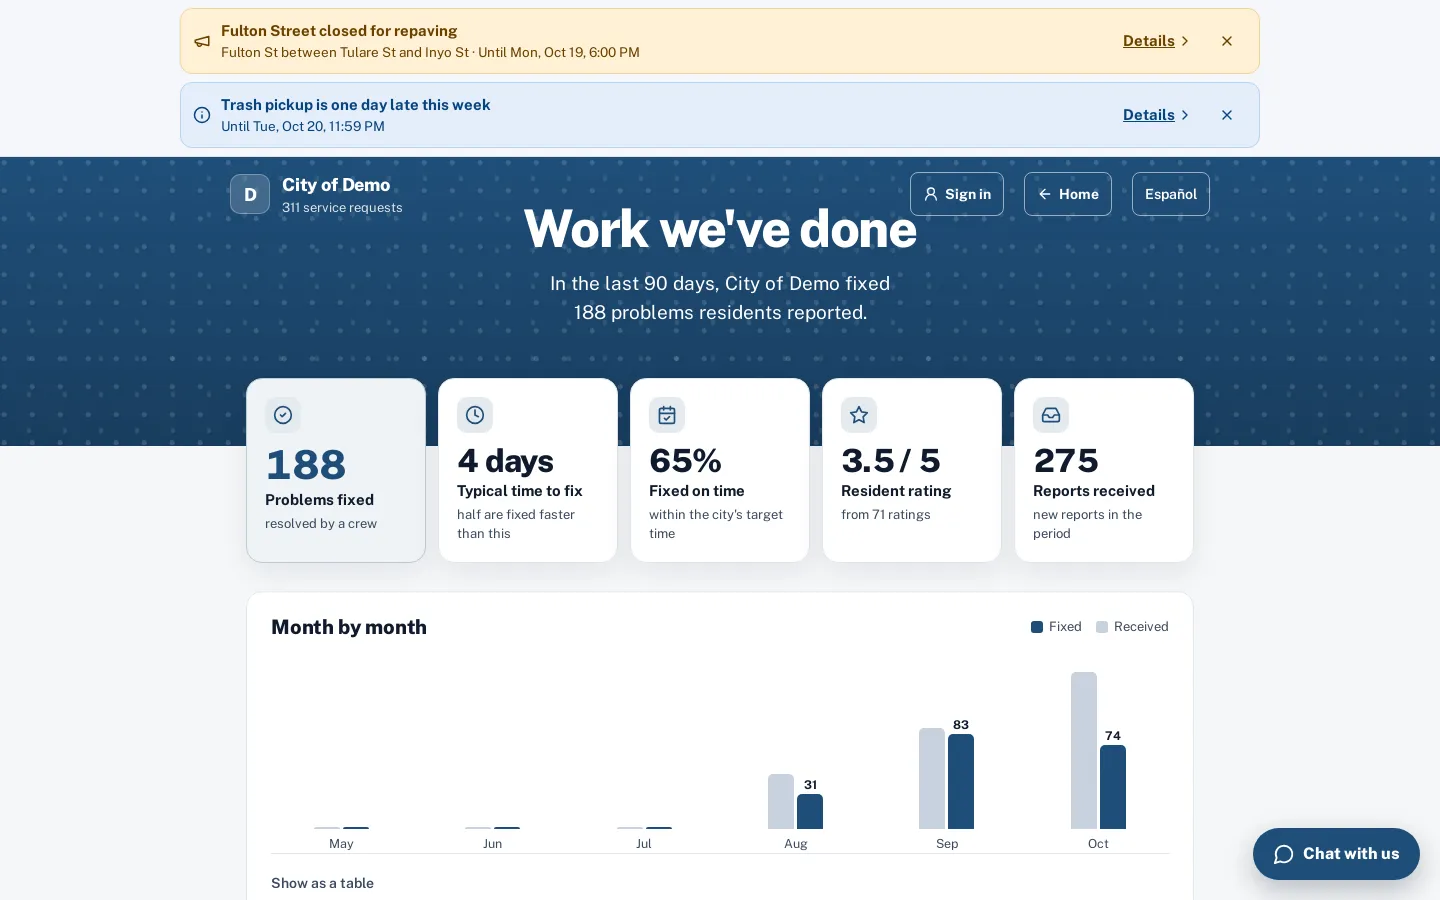
The public performance page is a transparency dashboard a city can switch on with one toggle. It shows requests fixed in the period, median days to fix, the share fixed on time, resident ratings and requests received; a month-by-month trend; results by request type and by council district; a gallery of recent before-and-after photos; and a map of fixes.
It’s built to protect residents: no names, contact details, house numbers or internal IDs; map points are rounded to about 100 meters; restricted departments are never included; and referred or merged requests never count as fixed. Staff decide which photos may appear, photo by photo.
Residents only hear about what’s broken. The work crews finish every day stays invisible.
How it works
Turn it on
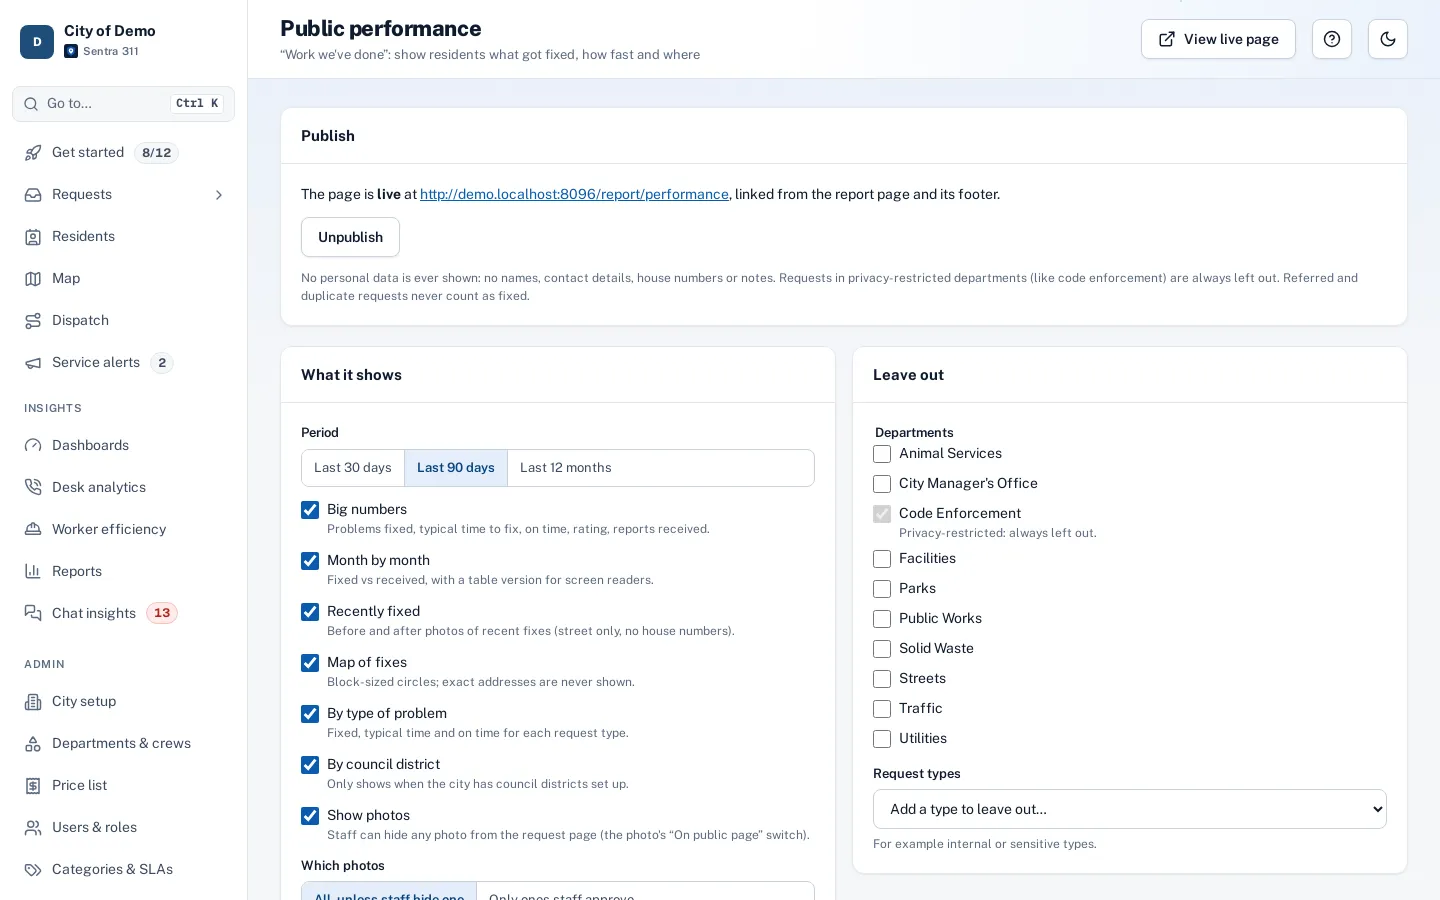
Pick the period and the sections.
Choose the photos
All photos unless staff hide one, or only ones staff approve.
Share it
A link from your report page, and an embed code for your city website.
Key features
Big numbers and trends
Fixed, time to fix, on time, rating and received, with a monthly chart and a table version.
Before-and-after gallery
Only photos staff allow; “only photos staff approve” mode is available.
Map of fixes
Points rounded to about 100 meters.
English and Spanish
Switches with the rest of the public site.
Embed on your website
A compact version with a copy-paste embed code.
Choose what’s shown
Period, sections, departments and types to leave out.
A day with it
Key numbers for the period the city chooses (30, 90 or 365 days): requests fixed, median days to fix, the share fixed on time, the average resident rating and requests received.
- A month-by-month chart of requests fixed, with a table version for screen readers.
- Tables by request type and by council district with counts, typical days to fix and on-time rates.
- A “Recently fixed” gallery with before-and-after photos, at most two per request type so it shows the range of work, and a map of fixes.
- A “How we measure” section explains each number.
- Admins choose which sections appear, whether photos show, and which departments or types to leave out, in Admin › Public performance.
- A compact embed version can be placed on the city website with a copy-paste code.
In practice
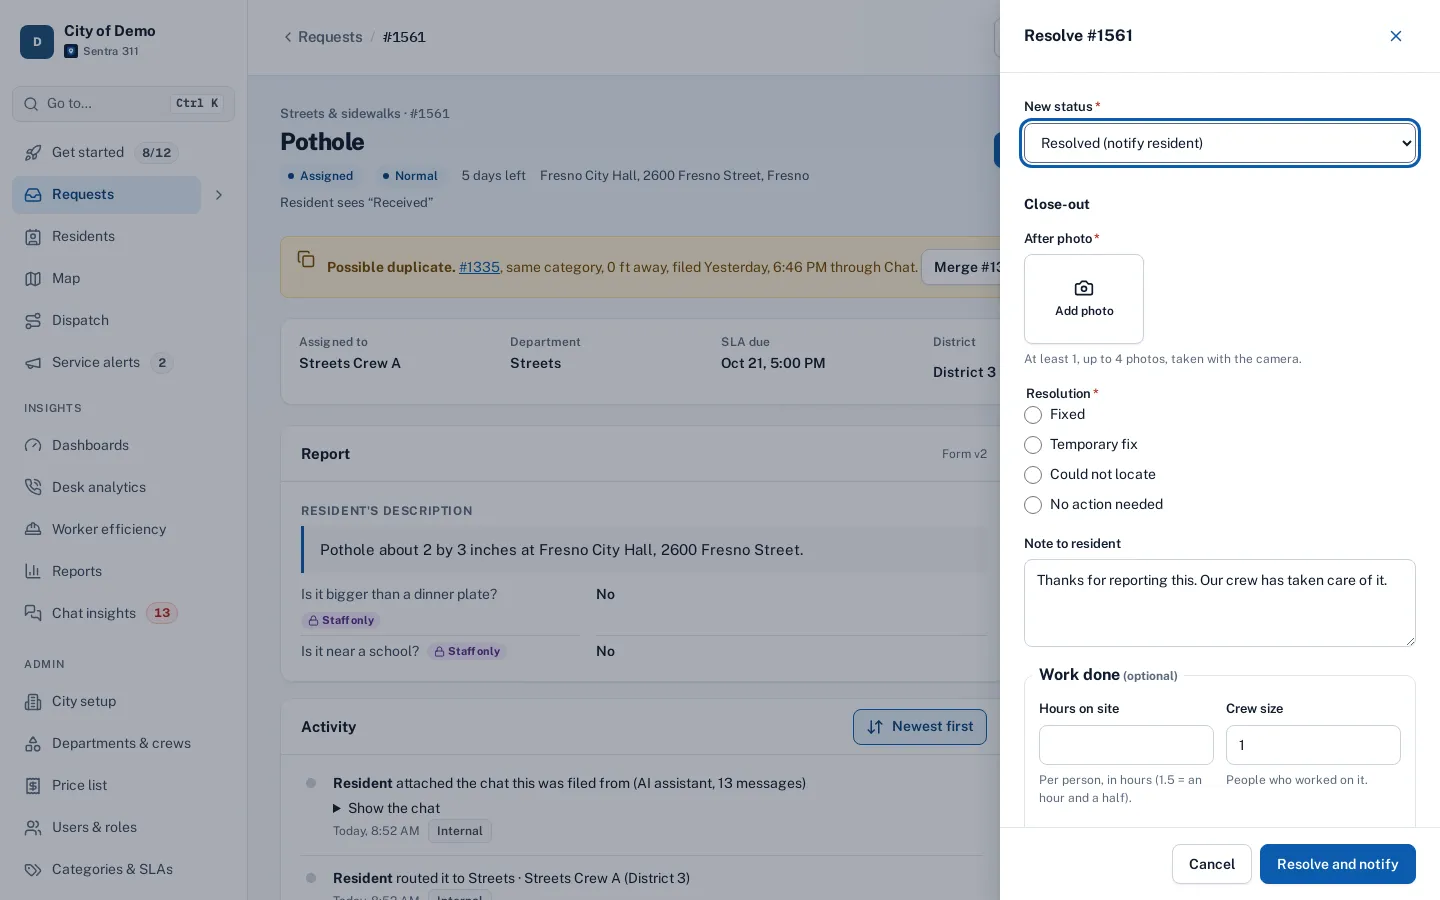
- Newsletter photos. Communications staff use before-and-after photos from the gallery, with staff approval.
- A council meeting. The city manager shows the public page’s on-time rate.
- On the city website. The compact embed sits on the public works page.
Privacy built in
The page never includes names, contact details, house numbers or internal IDs. Streets are shown without house numbers, map points are rounded to about 100 meters, restricted departments are always excluded, and referred or merged requests never count as fixed.
Who uses it
Residents
See what gets fixed and how fast.
Council and city managers
A public scorecard.
Communications staff
Real photos for newsletters and social posts.
Questions cities ask
Can we hide a photo after it’s published?
Yes. Switch it off on the request page and the page updates right away.
Is it on by default?
No. The page is off until a city publishes it.
Can residents see individual requests on it?
No. It shows totals, trends and a gallery of fixes without request details or personal data.
Does it update automatically?
Yes. It refreshes about every ten minutes, and hiding a photo takes effect right away.