
Reports anyone can run, no SQL.
Volume, response times, SLA met, backlog, reopen rate, ratings, trends, hotspots, workload, outcomes and more, grouped any way you need, and emailed on a schedule.
What it does
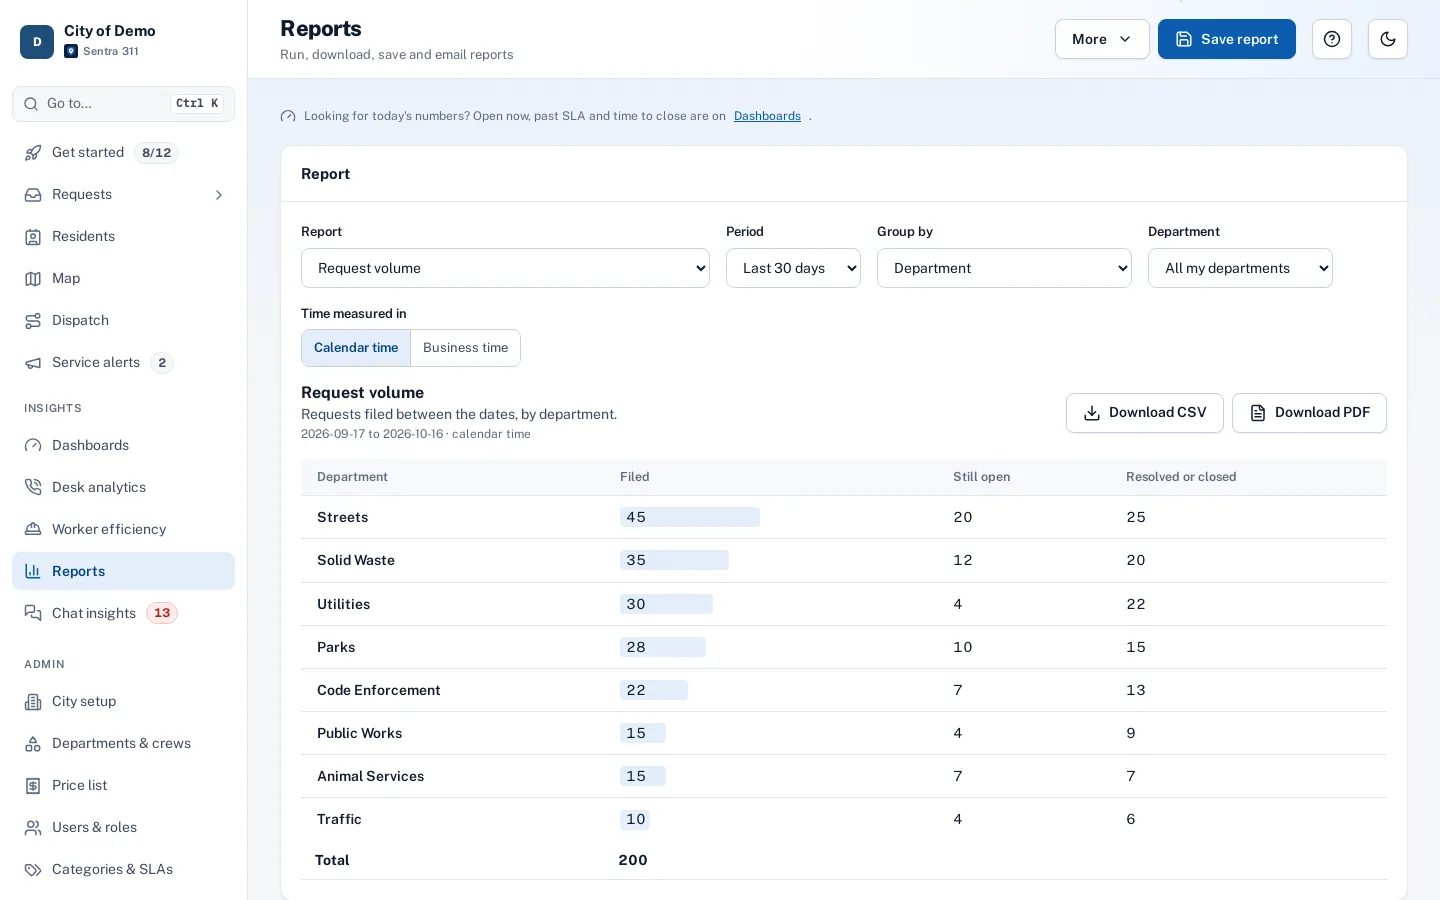
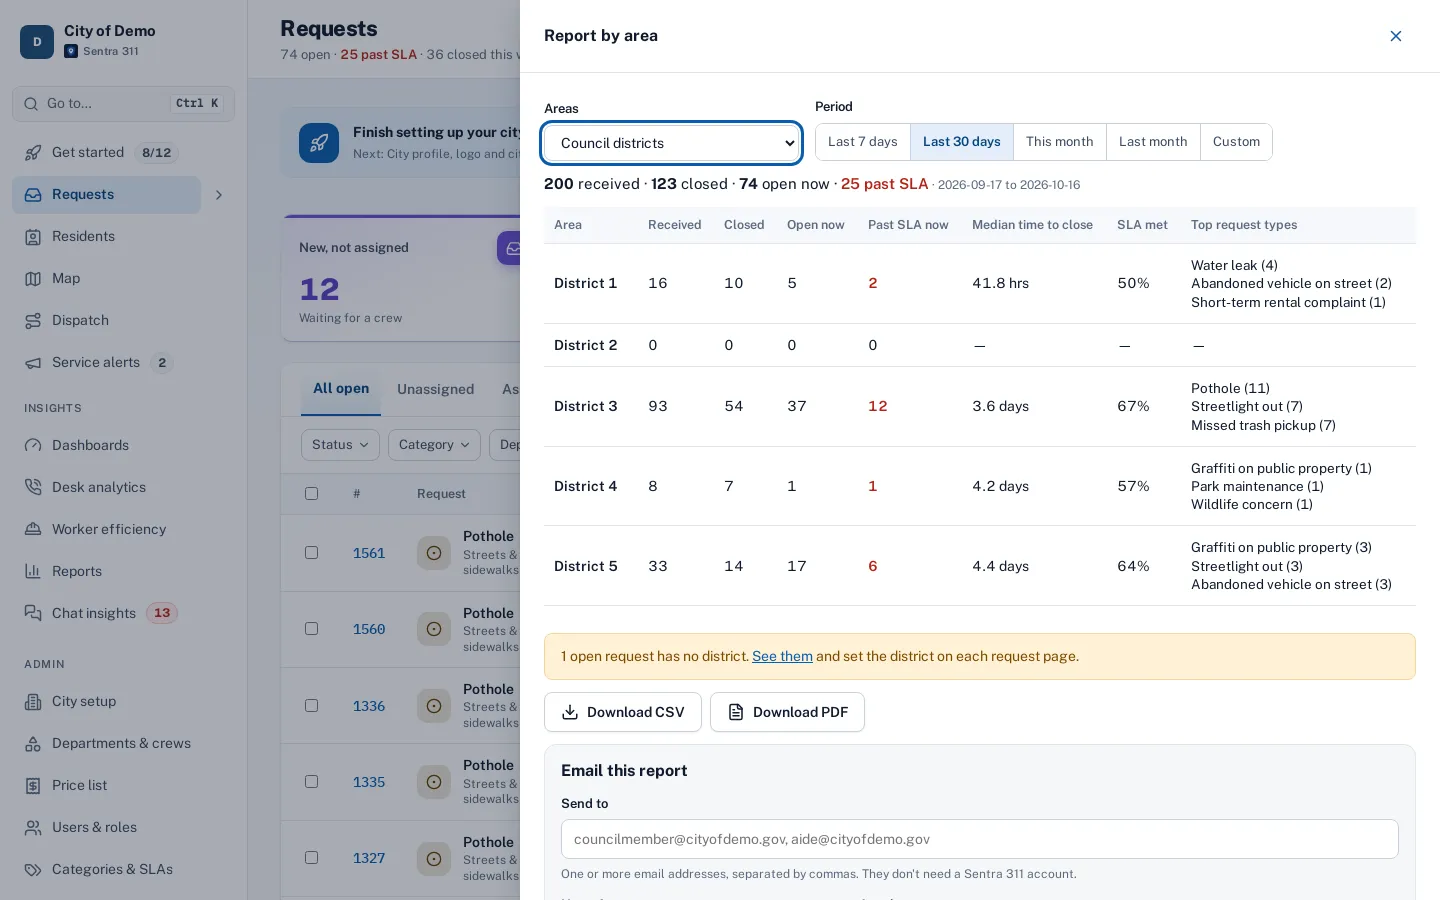
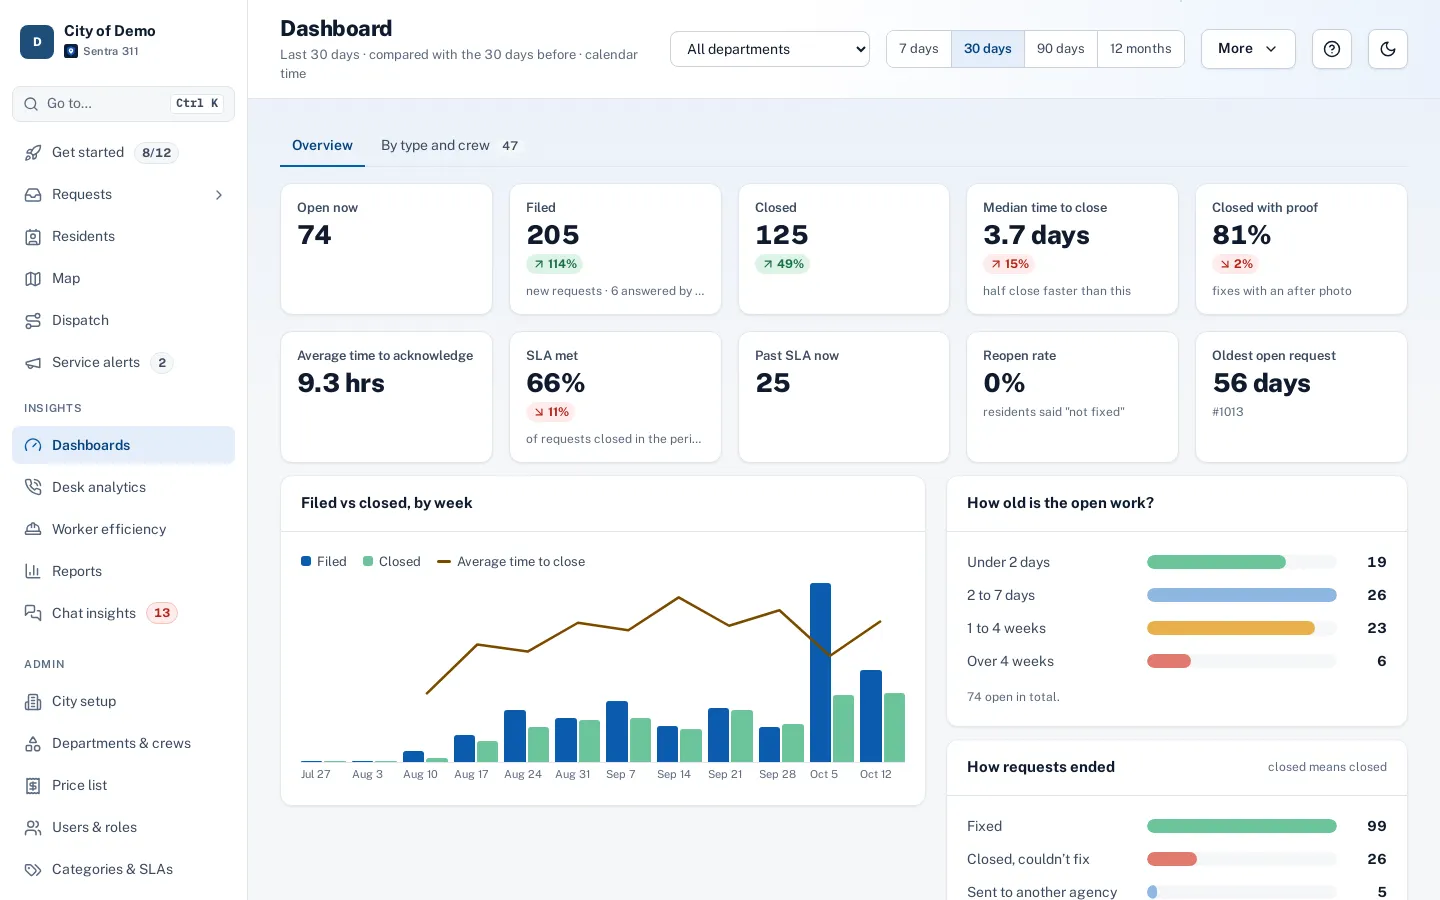
Sentra 311 includes ready-made reports for the questions cities ask most: request volume, time to acknowledge and resolve, SLA met, open backlog by age, reopen rate, resident ratings, trends, hotspots (locations with the most requests), crew workload, worker efficiency, area and council district summaries, and how requests ended — fixed, referred, merged or couldn’t fix.
Pick a period, choose how to group the results (department, request type, district, channel, priority, crew, assignee or any of your GIS layers), and measure time in calendar or business hours. Download CSV or PDF, save the report, and email it daily, weekly or monthly to anyone — they don’t need a Sentra 311 account.
Reports shouldn’t need IT or an export to Excel every Monday.
How it works
Pick a report and grouping
By department, type, district, channel, crew, worker or any GIS layer.
Save it
With a relative period like "last month".
Schedule it
Daily, weekly or monthly, as PDF or CSV, to anyone’s email.
Key features
Twelve report types
From volume and SLA to hotspots, outcomes and worker efficiency.
Group any way
Including your own GIS layers like council districts or trash days.
Calendar or business time
Fair time measurements using your hours and holidays.
CSV and PDF
Spreadsheet-ready or print-ready.
Scheduled emails
Daily at 7 AM, weekly on Mondays or monthly on the 1st, to any email address, or “send now”.
A day with it
Request volume (filed, still open, resolved or closed); time to acknowledge and resolve; SLA met; open backlog by age; reopen rate; resident ratings; trend (filed and resolved over time, with a chart); hotspots (locations with the most requests); crew workload (open now and resolved per assignee); worker efficiency; area summary (by council district or any area layer); and how requests ended.
- Most reports can be grouped by department, request group or type, district, channel, priority, crew, assignee, or any GIS lookup layer.
- Choose a fixed date range or a relative one (yesterday, last 7 days, last 30 days, this month, last month, last quarter).
- Saved reports with relative ranges re-evaluate on every run, so “last month” is always last month.
In practice
- Council packet. A clerk schedules a monthly PDF of volume and SLA by department.
- Budget season. Department heads export a year of workload by request type as CSV.
- Hotspots. The hotspots report points to the intersections with the most requests.
Schedules
A saved report can be emailed daily (covering the previous day), weekly on Mondays (covering the last seven days) or monthly on the 1st (covering last month), at 7 AM city time, as a PDF or CSV attachment, to up to twenty email addresses. “Send now” emails it immediately without changing the schedule.
Who uses it
City clerks
Council-ready numbers without SQL.
Department heads
Monthly reports that send themselves.
Council members
Their district’s numbers in their inbox.
Questions cities ask
Can people outside the city receive reports?
Yes. Any email address can be a recipient; the report shows only what its owner may see.
Do reports work with years of data?
Yes. Reports are calculated in the database; most return in under a second for a city with 100,000 requests.
Can a report include custom form answers?
The request export (CSV) includes one column per custom field.
Who receives scheduled reports?
Up to twenty email addresses per report; recipients don’t need an account.